Best cameo cards to buy right now
We record the TCGplayer market price of 1,868 cameo cards across 2,742 printings every day and compare each one with its own history. No card has a buy signal yet, so for now this page lists the biggest recent price drops.
No buy signals yet
Price tracking started on Oct 27, 2026. A printing needs 14 days of prices before we can say whether today's price is low for it, so the first buy signals should show up around Nov 9, 2026. Until then we would only be guessing, and we would rather not.
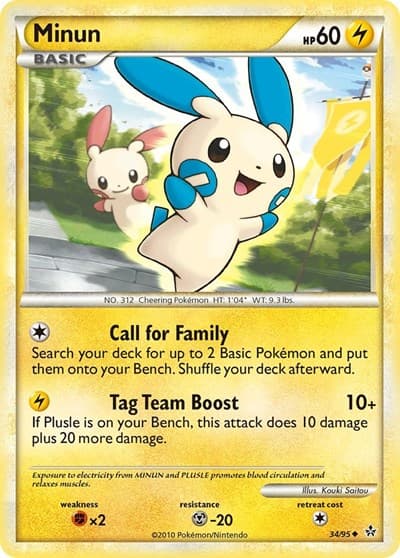
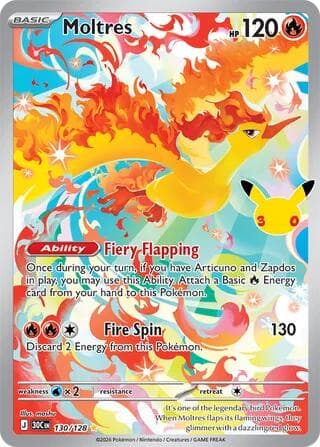
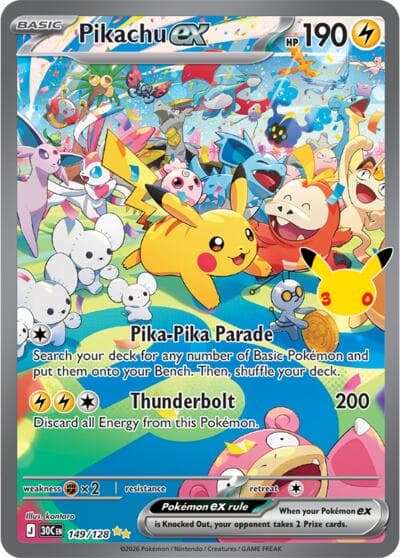
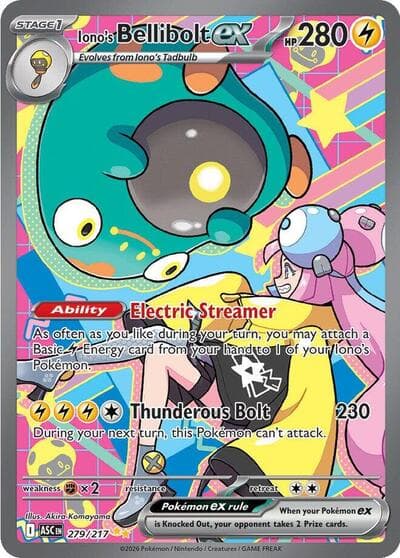
Biggest recent price drops
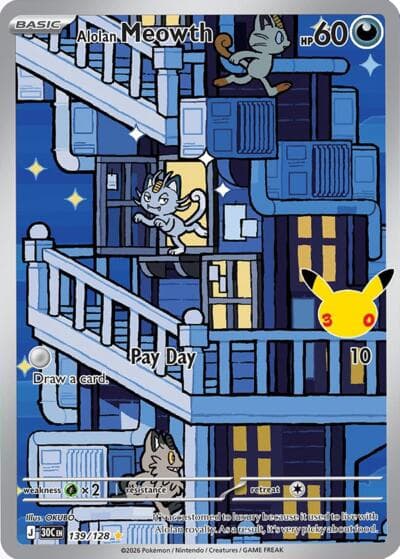
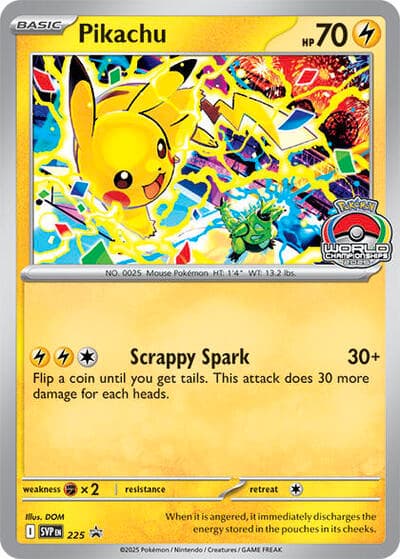
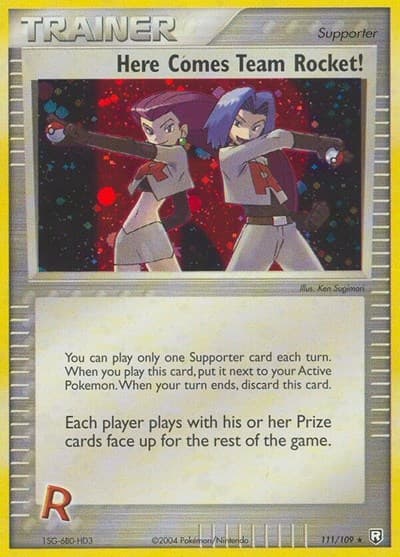
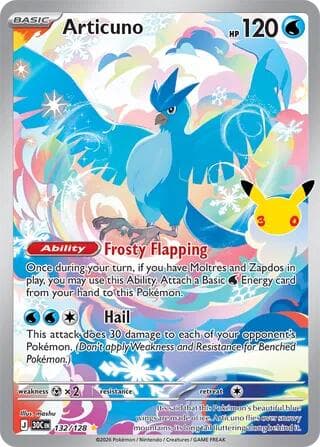
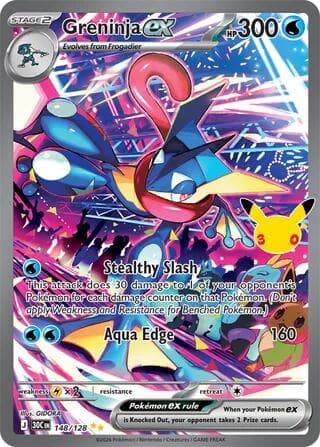
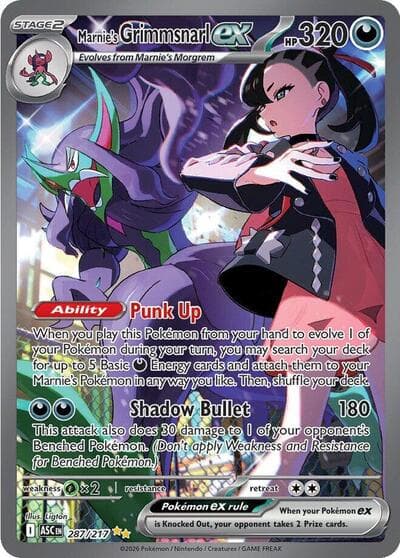
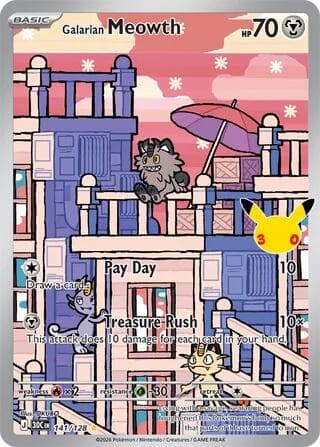
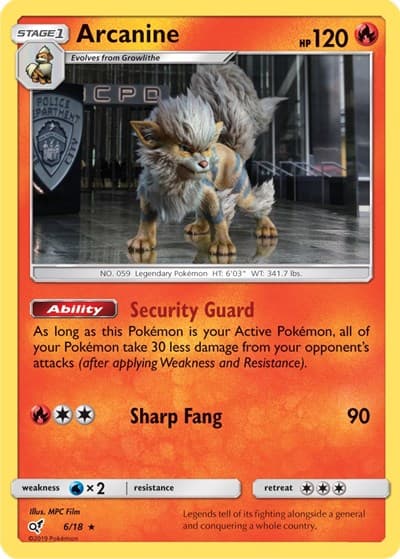
Cards whose market price fell the most over the last 30 days. A drop is not a buy signal on its own: it may keep falling.
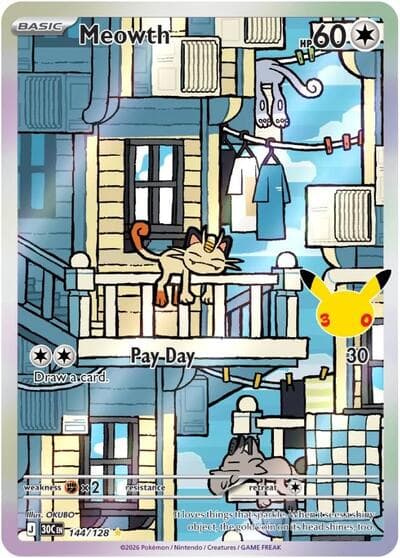
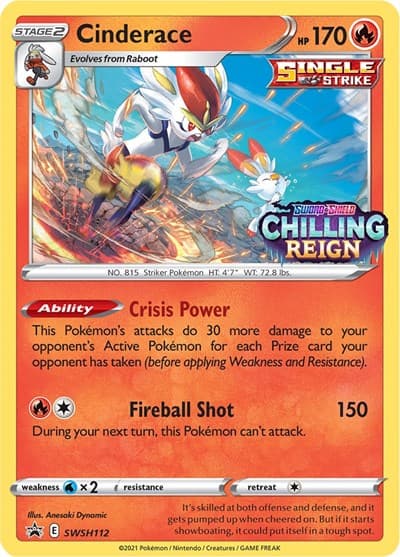
- 1TCGplayer
$4.83
-50% since Oct 2
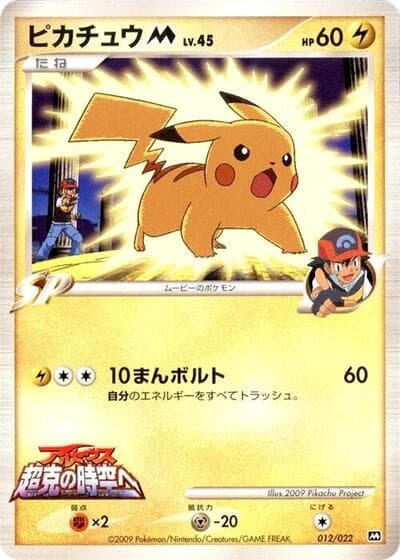
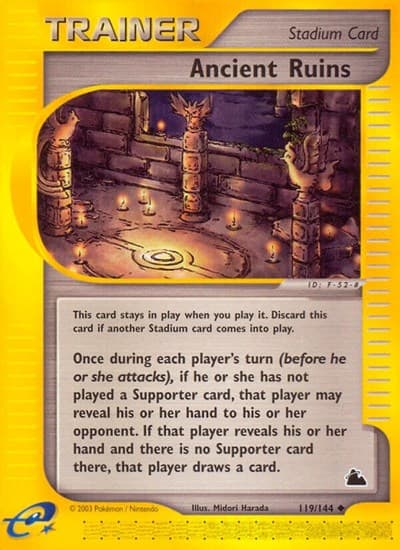
- 2TCGplayer
$40.00
-47% since Oct 2
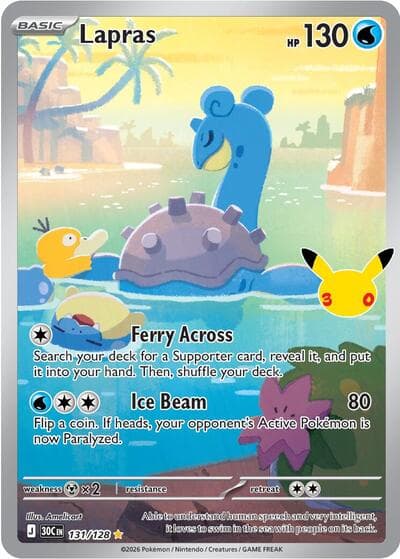
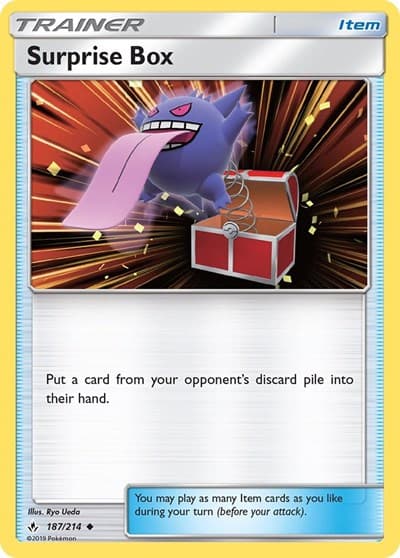
- 3TCGplayer
$3.99
-43% since Oct 2
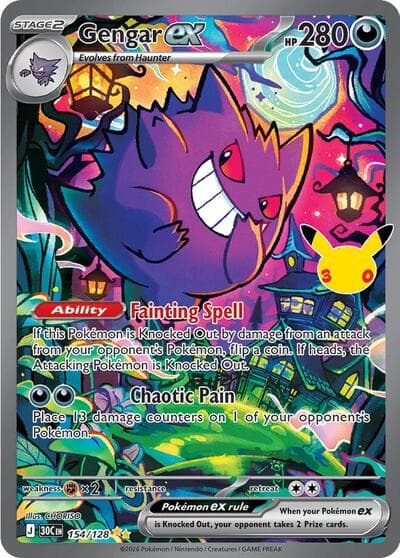
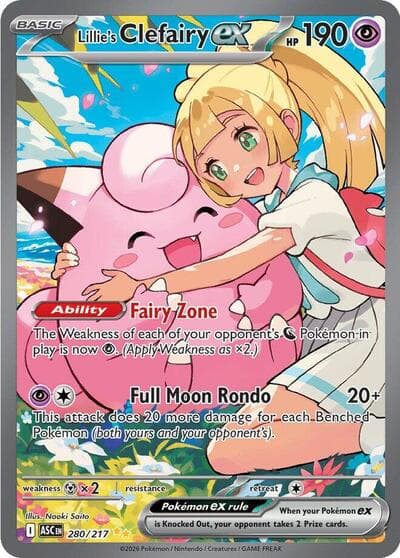
- 4TCGplayer
$191.33
-41% since Oct 2
- 5TCGplayer
$5.38
-40% since Oct 2
- 6TCGplayer
$7.18
-39% since Oct 2
- 7TCGplayer
$28.89
-39% since Oct 2
- 8TCGplayer
$54.78
-37% since Oct 2
- 9TCGplayer
$5.15
-37% since Oct 2
- 10TCGplayer
$64.47
-35% since Oct 2
- 11TCGplayer
$9.69
-35% since Oct 2
- 12TCGplayer
$4.99
-35% since Oct 2
- 13TCGplayer
$45.92
-35% since Oct 2
- 14TCGplayer
$36.60
-33% since Oct 2
- 15TCGplayer
$80.57
-32% since Oct 2
- 16TCGplayer
$20.95
-32% since Oct 2
- 17TCGplayer
$35.51
-31% since Oct 2
- 18TCGplayer
$5.75
-31% since Oct 2
- 19TCGplayer
$3.19
-30% since Oct 2
- 20TCGplayer
$2.89
-30% since Oct 2
- 21TCGplayer
$42.36
-29% since Oct 2
- 22TCGplayer
$1.57
-29% since Oct 2
- 23TCGplayer
$97.97
-28% since Oct 2
- 24TCGplayer
$3.06
-28% since Oct 2




How we pick these
How we pick buy and sell signals
Each printing of a card (Normal, Holofoil, Reverse Holofoil and so on) is compared only with its own price history. We look at where today's TCGplayer market price sits in its range over the last 6 months, how it compares with its 30-day average, and how much it moved in the last week. No predictions, just simple rules you can check on the chart.
What we measure for each printing
- 1Range position: where today's price sits between its lowest (0%) and highest (100%) price over the last 180 days.
- 230-day average: the average of the daily market prices over the last 30 days.
- 37-day change: today's price compared with the price about a week ago.
What each signal means
- Good time to buy
- Today's price is in the bottom 25% of its range and at least 10% below its 30-day average, and it has not dropped 10% or more in the last 7 days.
- Falling, wait
- The price dropped 10% or more in the last 7 days. Prices that fall that fast often keep sliding, so it may get cheaper.
- Pricey
- Today's price is in the top 25% of its range and at least 5% above its 30-day average. A good time to sell, not to buy.
- Fair price
- Anything in between. A price whose highest and lowest points are less than 10% apart is also fair, since it has barely moved.
- Not enough data
- Fewer than 14 days of prices, no price in the last 10 days, or a price under $1, where a few cents of movement looks like a big swing.
Good to know
- Prices are TCGplayer market prices, collected once a day through tcgcsv.com. Daily collection started on October 27, 2026, with a few earlier snapshots, so early signals rest on short histories.
- Cards that rarely sell can jump on a single sale, so their signals are noisier.
- The best cards to buy are ranked by how far below their 30-day average they are, with less weight for cards with under 60 days of history.
- This is not financial advice. Check recent sales and card condition before you buy.